 © Onsala Space Observatory
(*) ILT: International LOFAR Telescope
© Onsala Space Observatory
(*) ILT: International LOFAR Telescope
 © Pieter Benthem
The picture shows 2 modified MWA beam former boxes (with green caps on), housing the 16 RFoF links. These boxes handle the X-polarization. One box is the transmitter and the other the receiver, with the fibre (black surface cabling, laid out in a loop behind the boxes) in between, replacing the coaxial cabling. The third box is unmodified, and handles the Y-polarization.
The ASTRON hardware, as can be seen on the daily image of 05-01-2015, is driving this development.
In the coming days, we will wrap up the installation and start testing the array. Before we disassembled the coaxial cabling, we performed a reference measurement on the bright radio source Hydra A, which we will be repeated when the array is up and running.
The Low Frequency Aperture Array (LFAA) covers the lowest frequency band of the SKA, from 50MHz up to 350MHz, as described in the Baseline Design. To transport the dual polarised antenna signals over the required distance of up to 10 kilometres towards the processing facilities, RFoF technology is used.
Many thanks for all the work done by the ICRAR and ASTRON team!
 © ASTRON
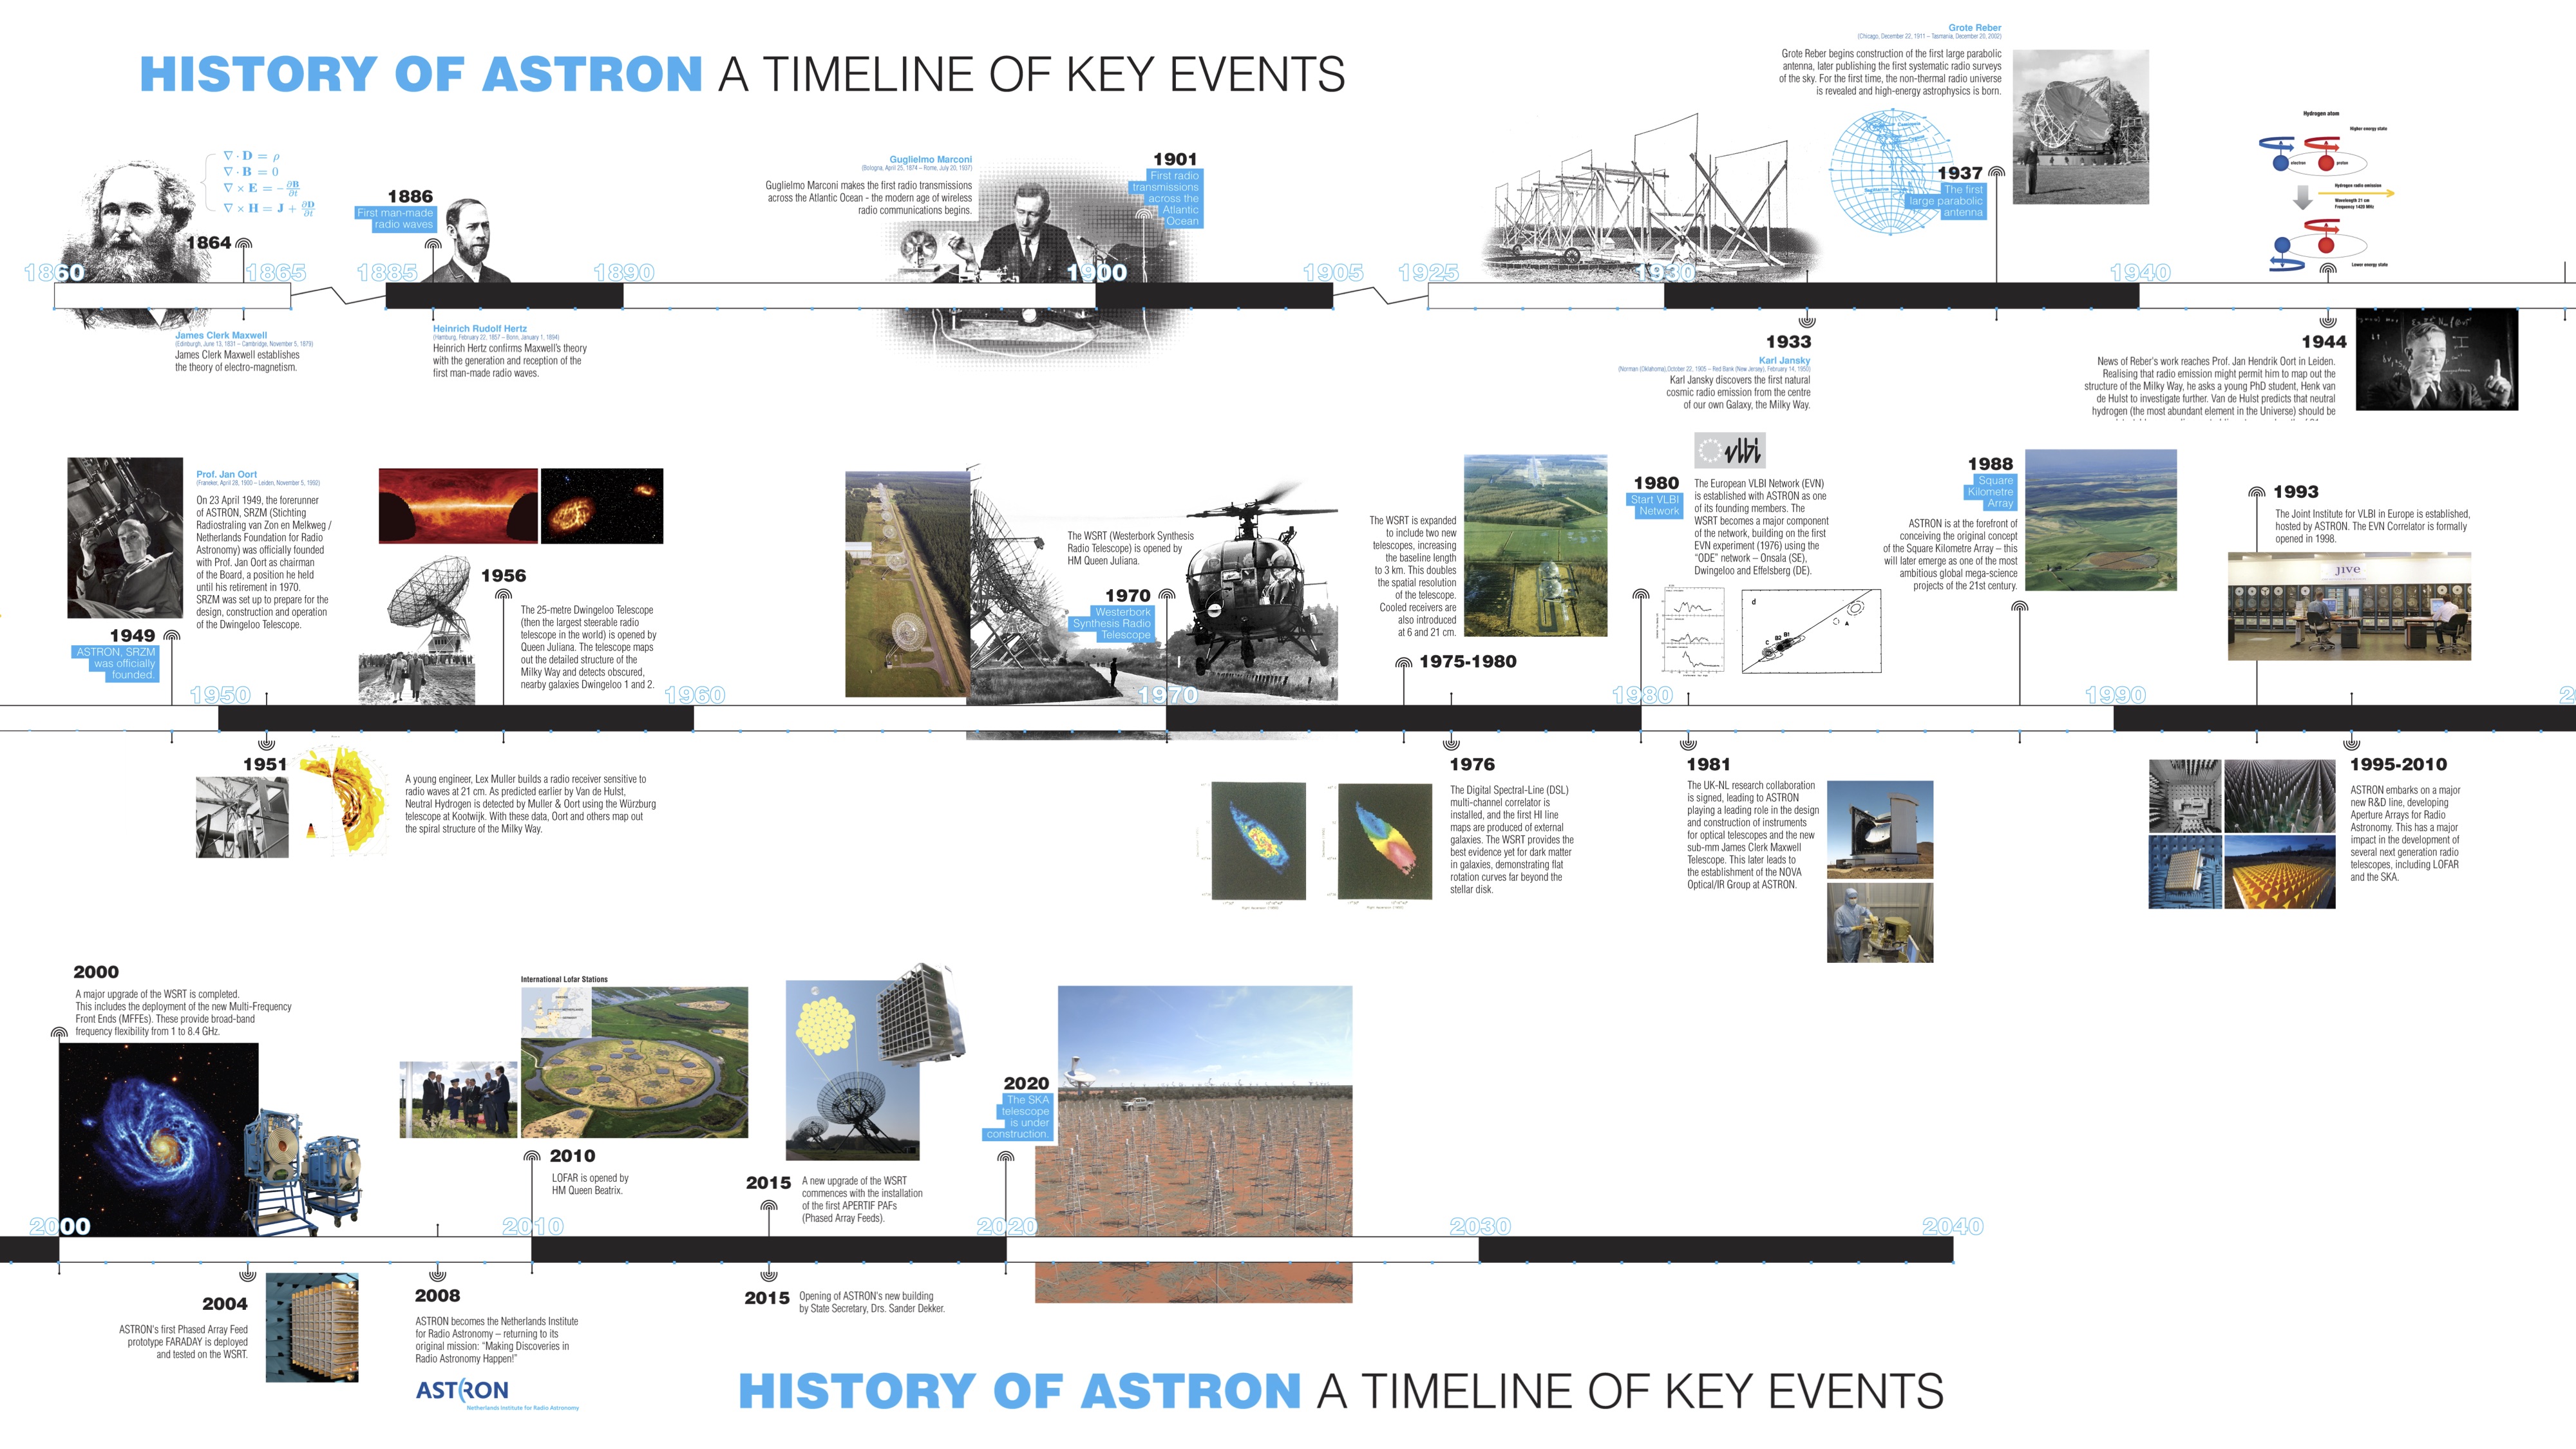
The timeline begins with 3 important contributions that were essential for the development of radio science and techniques. The first was the publication by James Clerk Maxwell of his theory of electro-magnetism almost exactly 150 years ago. 20 years later, Heinrich Hertz became the first person to generate man-made radio waves, confirming Maxwell's theory. Some ten years after that, Guglielmo Marconi began to use radio waves as a way of enabling long-distance communication. And 20 years after that, radar was invented by Robert Watson Watt changing the course of European history. The rest, as they say, is history. Today these fundamental developments underpin everything we do at ASTRON, and radio science itself pervades all of society - our mobile phones, our GPS systems, civilian and military radar, global satellite communications, wifi and the internet.
The timeline is of course incomplete - there is a bright future ahead for ASTRON and there is still quite some space on the wall to detail our continuing story of discovery in radio astronomy!
Many thanks to those that shared their images used in the timeline, incl. Tom Oosterloo, Joeri van Leeuwen, Michiel van Haarlem, Huib van Langevelde, Richard Porcas. Also many thanks to the many people who helped in retrieving images from the archive etc.
 © Tom Oosterloo/Cees Bassa
Recently, a wolf was spotted very close to the WSRT. People did not go out to see that animal�
 © Vlad Kondratiev
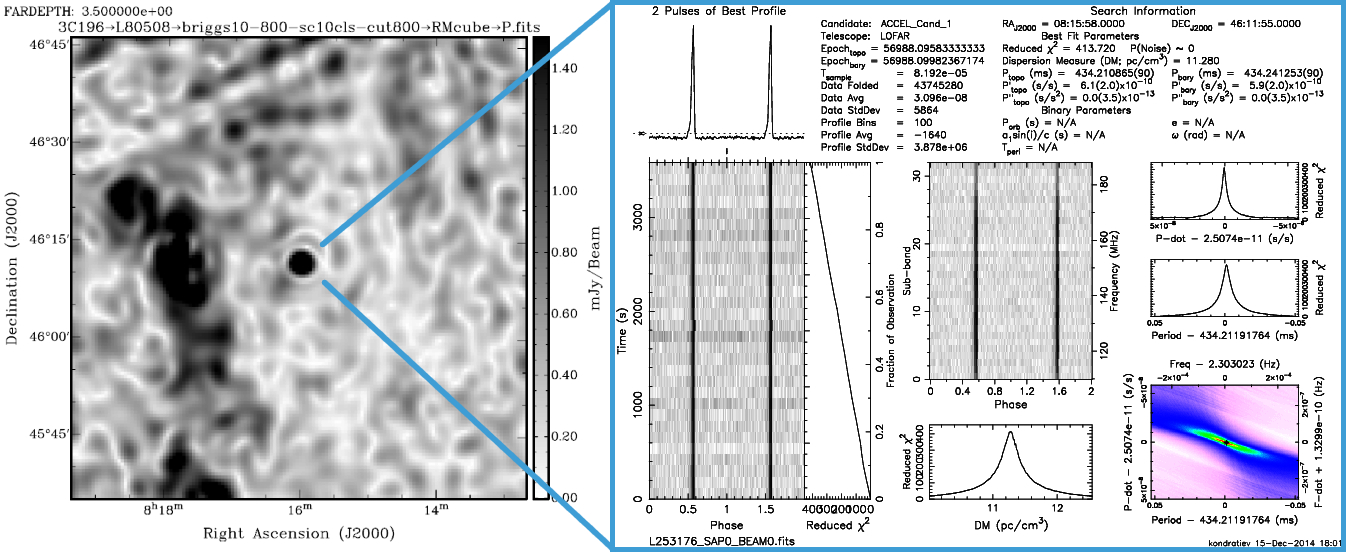
It was first identified by Ger de Bruyn in the deep EOR observations of the 3C196 field as a point source with very high polarisation fraction (∼50%) and steep spectrum (index Navarro, de Bruyn, Frail et al. 1995, ApJ, 455, 55).
We performed the follow-up 1-h HBA observation with the full core tied-array beam. We searched the dedispersed data for periodic and single-pulse signals and to our excitement we found the pulsar! It's a long-period pulsar with the period P = 434 ms and dispersion measure of 11.28 pc/cm^3; the latter corresponds to a distance of only about 400 pc. From the beamformed data we derived a rotation measure of +3.35 rad/m^2, a high fraction of linear polarisation (>50%), a mean flux density of about 8 mJy, and a very steep spectral index of -2.6. These parameters all agree precisely with what was previously inferred from the EOR images. Thus, the pulsar must be Candi2!
The left figure shows the polarimetric image at a Faraday depth of +3.5 rad/m^2 (uncorrected for ionosphere). Candi2 is in the middle with other diffuse features being from polarised Galactic foreground emission with a similar Faraday depth. On the right is the diagnostic plot from our pulsar search, showing the pulse profile (repeated twice) as a function of time and frequency.
All the LOFAR pulsar discoveries so far can be found on the LOFAR Tied-Array All-Sky Survey (LOTAAS) web-page here.
 © Astron
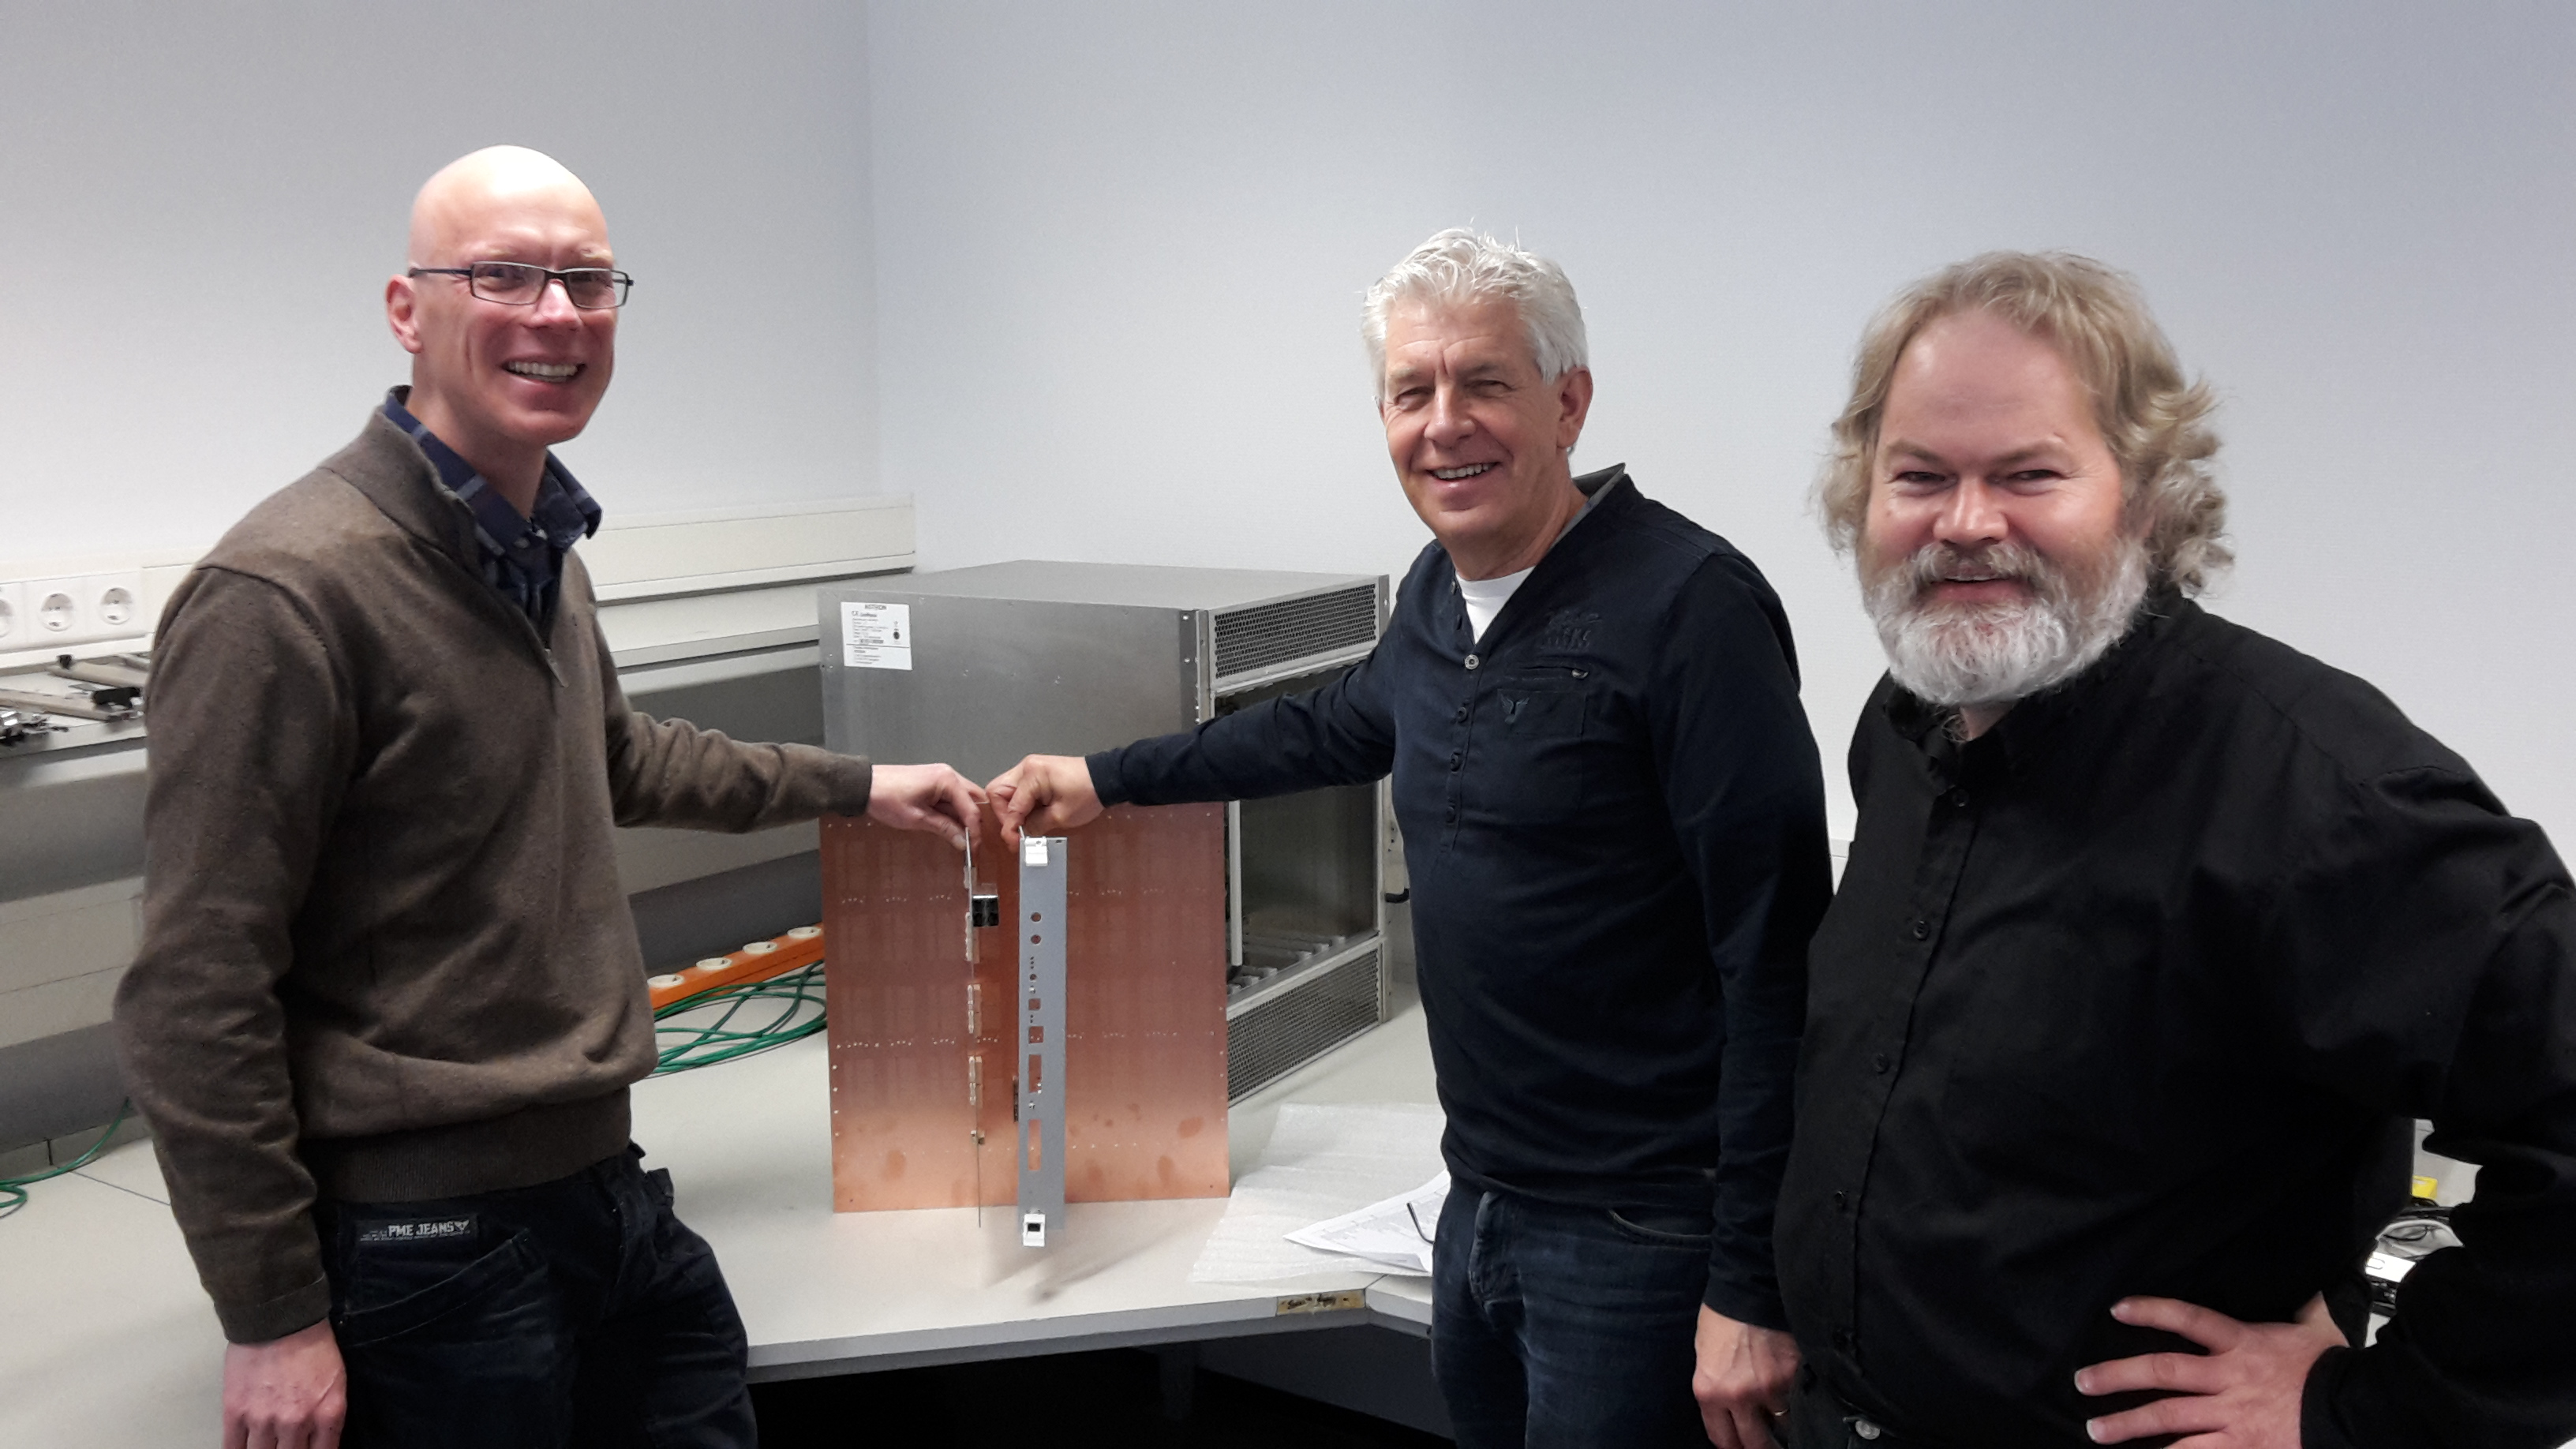
"In theory there is no difference between theory and practice, but in practice there is"(*). This is why Gijs, Sjouke and Sieds (left to right on the photo) make mock-up boards first, before ordering the actual printed circuit boards. This allows us to verify whether the boards will really fit together in the rack as specified.
The mock-up boards are made in-house by Albert van Duin. The photo shows one for the OEB (Optic to Electrical Board), the COBI (Correlator Backplane Interfaces) and the miniPAC (mini version of PAC Power and Clock distribution). The Apertif correlator will use these new boards in a subrack, together with 8 UniBoards and 1 PAC board. We already have the UniBoard and PAC boards because they are also used in the Apertif beamformer subrack.
 © ESA, NASA & Felix Mirabel
Over the last decade a lot of new and exciting observational information has been obtained for systems accreting at rates that are orders of magnitude lower than commonly observed. During this colloquium I will present an overview of our current understanding of sub-Eddington accretion flows in neutron-star low-mass X-ray binaries and I will also highlight the differences and similarities between those systems and the transitional millisecond pulsars (i.e., during their accretion phase), which are a recently recognized special class of neutron-star binaries that can accrete at very low rates.
 © Science journal and Wolfgang Steffen (Instituto de Astronomía, UNAM)
We have observed and reported in Science the evolution of the collimation of a radio jet emitted from the high-mass protostar W75N(B)-VLA2. A pair of radio images of the young star, made 18 years apart, has revealed a dramatic difference in morphology that is providing us with a unique, "real-time" look at how massive stars develop in the earliest stages of their formation. The first image obtained with the Very Large Array (VLA) in 1996 shows a compact source of a hot, ionised wind ejected from the young star (top left panel). The 2014 image, observed with the Jansky VLA, shows that ejected wind deformed into a distinctly elongated outflow (left bottom panel).
Furthermore, the magnetic field around W75N(B)-VLA2 developed a preferred direction aligned with the large scale magnetic field in the region. Now we have observed that also the outflow is in the same direction, indicating that magnetic forces are important in the formation of this star.
We think that the young star is forming in a dense, gaseous environment, and is surrounded by a doughnut-shaped, dusty torus. The star has episodes in which it ejects a hot, ionised wind for several years. According to a simple model, that wind can initially expand in all directions, forming a spherical shell around the star. Later, the wind hits the dusty torus, which slows it. Wind expanding outward along the poles of the torus, where there is less resistance, moves more quickly, resulting in an elongated shape for the outflow.
Image caption:
Left panels: Comparison of the K band continuum emission of VLA 2 in epoch 1996 (top) and 2014 (bottom). Image Credit: Science journal.
Right panels: 3D hydrodynamic simulation and visualization (generated in the Shape software) of an episodic, short-lived, originally isotropic outflow ejection (top) from the massive protostar W75N(B)-VLA 2, whose morphology evolves into a collimated outflow (bottom) as it expands within a toroid of dust and gas. Image Credit: Wolfgang Steffen, Instituto de Astronomía, UNAM.
 © ASTRON/H.J.Stiepel
At this meeting, an overview was presented of the current status of the SKA project and of the SKA Preliminary Design Reviews. After these presentations, each workstream reported on their progress, relevance to SKA, and plans for going forward. Overall, we could conclude significant and important progress in all areas. This is also witnessed by the impressive number of 42 publications in 2014 and 14 publications in the pipeline. In addition, each workstream reported on planned publications.
On the SKA front, just after the re-baselining, we can report on significant impact on several areas of the SKA program. This includes design work for the SDP consortium in which ASTRON-DOME leads two central work-packages, and the RFoF work which is currently being tested in Australia. In addition,
At the end of the second meeting day, the team also met with companies and a knowledge institute interested in the Dome R&D, and potentially interested in joining the Dome Users Platform. All in all, this was an excellent meeting which showed great progress and a truly collaborative atmosphere.
 © JIVE
.png) © Francesco de Gasperin
© Francesco de Gasperin
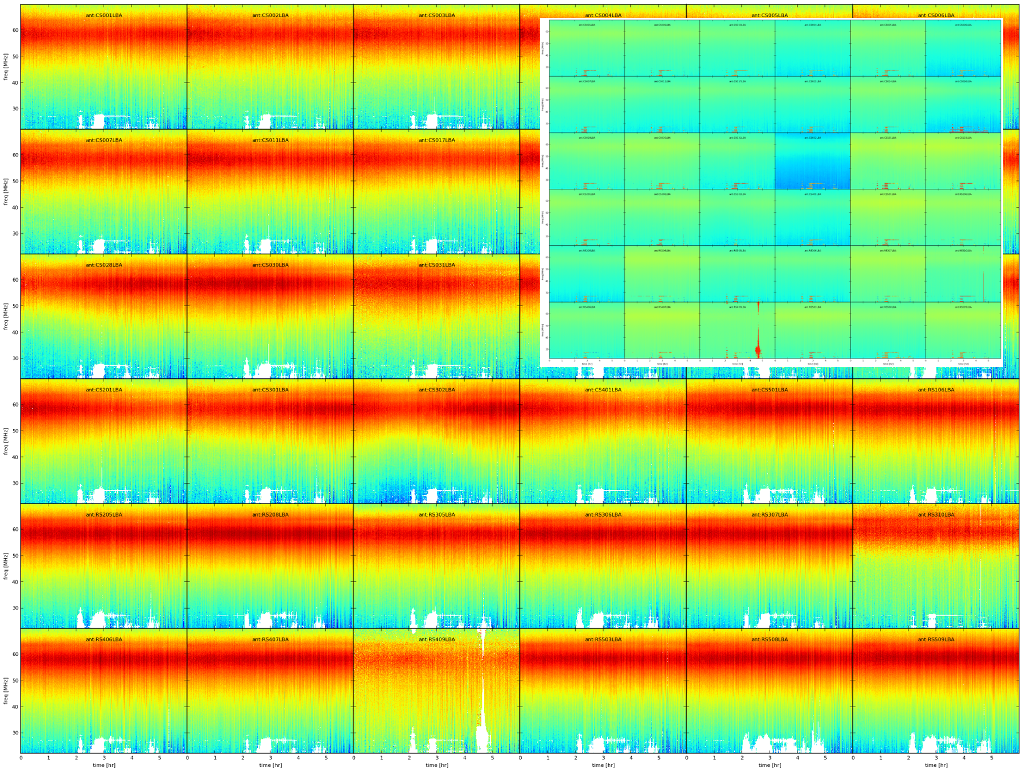
Ionosphere and clock drifts drive most of the variation, both these effects are time dependent. As a consequence remote stations, which have independent clocks and observe through a significantly different ionosphere, change phase faster then
core stations.
The combined effect of clock and ionosphere is clearly marked also by the fast phase rotation of remote stations. For some of the remotest stations a ionospheric-induced frequency dependency of the phase solutions is also visible (e.g last panel). White patches are flags applied by LoSoTo using amplitude-only information (see subsequent daily image).
 © Dieter Engels
The phase-lag of the variable emission from the back and front sides of the shells is determined for 20 OH/IR stars in the galactic disk. It is measured on the base of a monitoring program with the Nancay radio telescope ongoing for more than 6 years. Recent eMERLIN and eVLA observations of several stars provided angular diameters.
The new distances for the sample will provide an improved estimate of the mass range from which these highly obscured stars descend from. I will discuss the new distances obtained and the uncertainties inherent in the method.
© ASTRON/H.J.Stiepel
At this meeting, an overview was presented of the current status of the SKA project and of the SKA Preliminary Design Reviews. After these presentations, each workstream reported on their progress, relevance to SKA, and plans for going forward. Overall, we could conclude significant and important progress in all areas. This is also witnessed by the impressive number of 42 publications in 2014 and 14 publications in the pipeline. In addition, each workstream reported on planned publications.
On the SKA front, just after the re-baselining, we can report on significant impact on several areas of the SKA program. This includes design work for the SDP consortium in which ASTRON-DOME leads two central work-packages, and the RFoF work which is currently being tested in Australia. In addition,
At the end of the second meeting day, the team also met with companies and a knowledge institute interested in the Dome R&D, and potentially interested in joining the Dome Users Platform. All in all, this was an excellent meeting which showed great progress and a truly collaborative atmosphere.
 © Daniele Michilli / PWG
Rotating RAdio Transients (RRATs; McLaughlin et al. 2006) are
sporadically emitting pulsars. Finding more RRATs is important in
order to have a complete picture of the radio-emitting neutron star
population. Also, understanding why their behavior is in some cases
quite different compared to "steady" pulsars is important for
understanding the pulsar radio-emission mechanism.
LOFAR's first RRAT discovery is shown in this plot, where the pulses
from the neutron star are highlighted in blue. The bottom panel of
the plot shows all the significant pulses detected in beam 56 of
sub-array pointing 2 of observation L202425. These are plotted as a
function of dispersion measure and time. The discovered RRAT has a
dispersion measure close to 78 pc/cm3 and a period of 2.23 s (or some
integer fraction of this). About ten bright single pulses have been
detected from the source in the one-hour discovery observation.
The discovery has been made as part of the LOFAR Tied-Array All-Sky
Survey (LOTAAS), an ongoing survey for pulsars and fast radio
transients, which has previously discovered another 13 new pulsars
(www.astron.nl/lotaas). The irregular emission of RRATs makes them
difficult to detect in periodicity searches. For my PhD I am
developing new techniques to sift through the LOTAAS data in order to
find more individual dispersed pulses. This is a very challenging
task because each LOTAAS pointing contains 222 beams, each with
thousands of frequency channels, and millions of time samples!
 © ASTRON
Based on the properties of our WLNT receiver system (gain, second order intercept point) and measured RFI-levels at the measurement site (see the RFI-spectrum on display), we calculated the levels of in-band intermodulation products for RFI-signals below 1000 MHz. As an example the total power plot shows the expected intermodulation products between 1220 MHz and 1270 MHz (lower, magentic line). Also shown is the output spectrum (upper, blue line) of the 2x2 array looking at broadside. Notice that the calculated intermods are between 10 and 15 dB below the system noise level and will influence the noise measurement. Some in-band signals are visible in the blue line, as well as a noisy structure and a spike above 1250 MHz. The noise temperature plot clearly shows the effect of the in-band signals on the measured array noise temperature (blue line). It also shows a considerable increase in noise temperature due to intermods between 1230 and 1240 MHz.
In our WLNT-receivers the last amplifier stage sees the largest RFI-levels and thus will be dominant in the production of intermods. One may illustrate the effect of the intermods on the noise by reducing their level, either placing a 6 dB attenuator or a bandpass filter before the last amplifier stage. This will reveal which signals are due to intermodulation and which are original in-band signals. Indeed the total power spectrum plots (red line with filter and green line with attenuator) show a much cleaner and flatter response. At the same time the noise temperature plots at frequencies where the intermods occur show a considerable improvement with the attenuator and filter, while at in-band RFI-frequencies noise peaks remain. These results explain the anomalies in noise temperature at certain frequencies that we found in previous measurements and underline the importance of an optimally dimensioned RF-chain.
 © NOVA Optical IR Instrumentation Group, Rijksuniversiteit Groningen, Isaac Newton Group of Telescopes (ING)
The principal science goals are twofold:
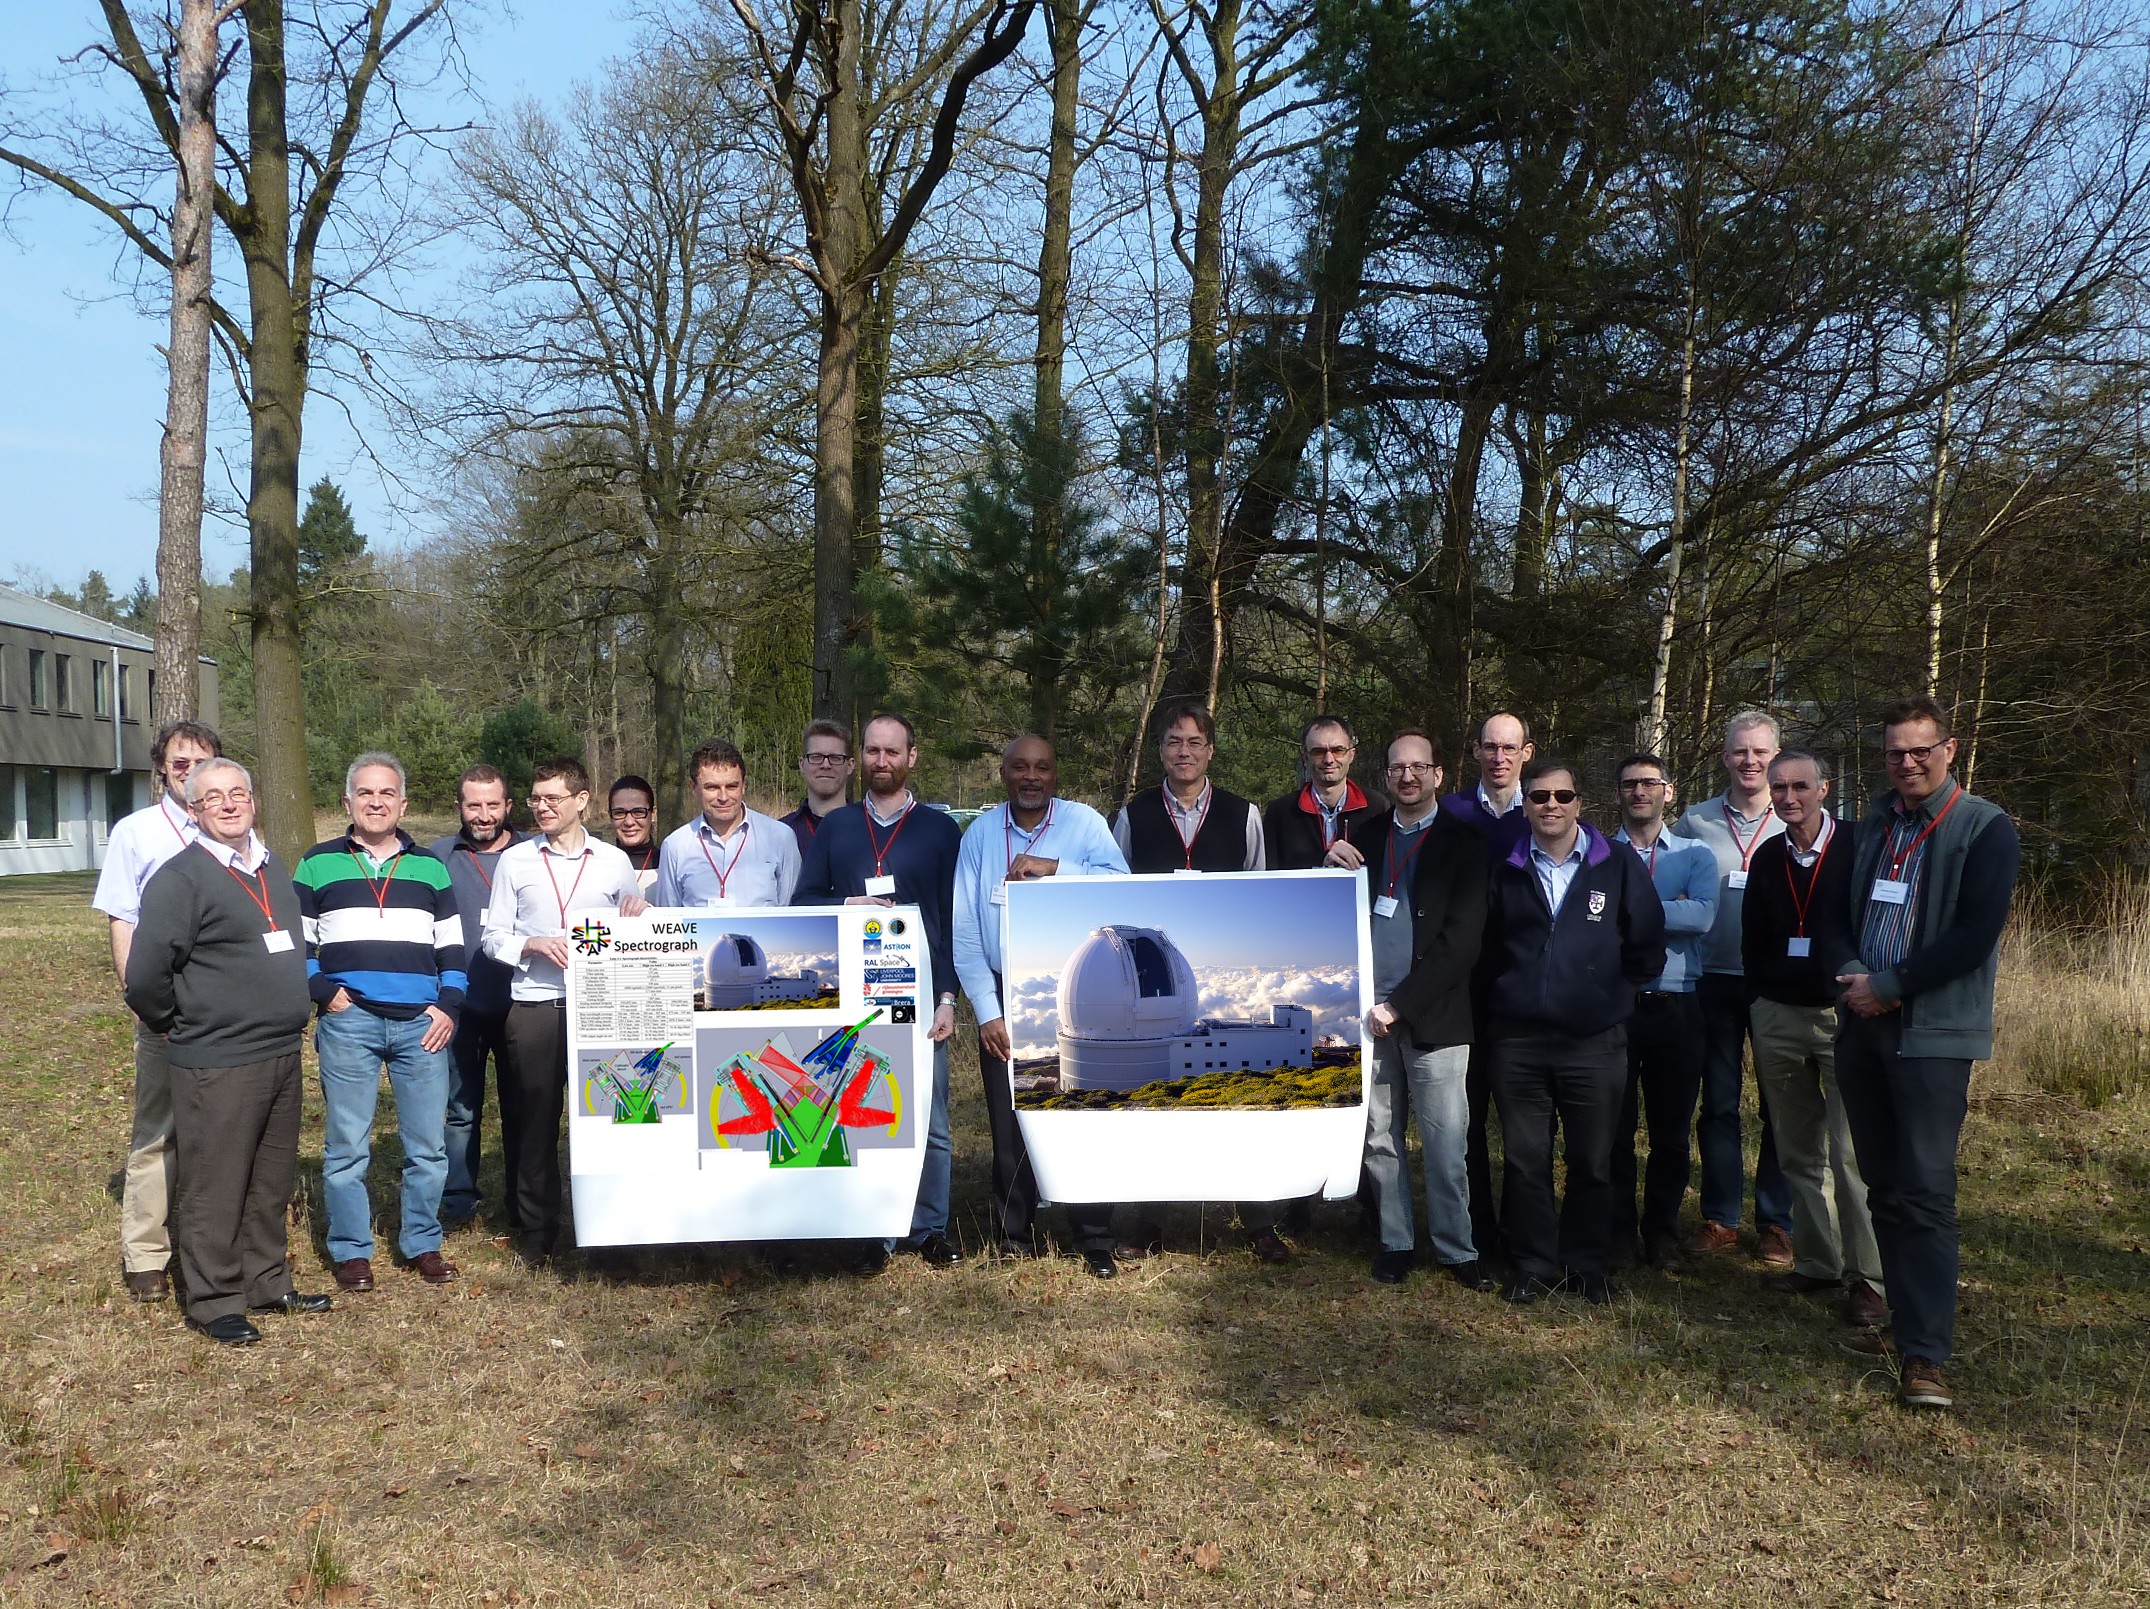
The Final Design Review of the Spectrograph of WEAVE took place last 17 and 18 March at ASTRON. The team successfully passed this important milestone. The picture shows the Review Board, the WEAVE management team and the Spectrograph team in the backyard of ASTRON.
The Spectrograph team is a collaboration between NOVA Optical IR Instrumentation Group at ASTRON (Optomechanical Design and Production, Management), RAL in the UK (Optical Design), JMU Liverpool in the UK (Detectors), IAC at Tenerife Spain (Control Hardware), ING at La Palma Spain (Control Software), INAF Italy (VPH Gratings and Control Software). Dutch PI is Scott Trager, Kapteyn Astronomical Institute, RUG.
http://www.ing.iac.es/weave/index.html
http://www.astron.nl/dailyimage/main.php?date=20130319
 © Francesco de Gasperin
 © DG
© DG
 © ASTRON / NIOZ, 2015
However, the engineers at NIOZ found out that radio waves behave quite different from the water waves they are used to. They could not get the radio link to work and turned to ASTRON. At the ASTRON RadioLab, we performed some measurements and isolated the problem. With some quick fixes, we managed to demonstrate a proof of concept to improve the stability of the link, to great satisfaction of our NIOZ colleagues. Fascinated by RF technology, two people from NIOZ participated in the March edition of the ASTRON RF course.
 ©
© 


