Image may be NSFW.
Clik here to view.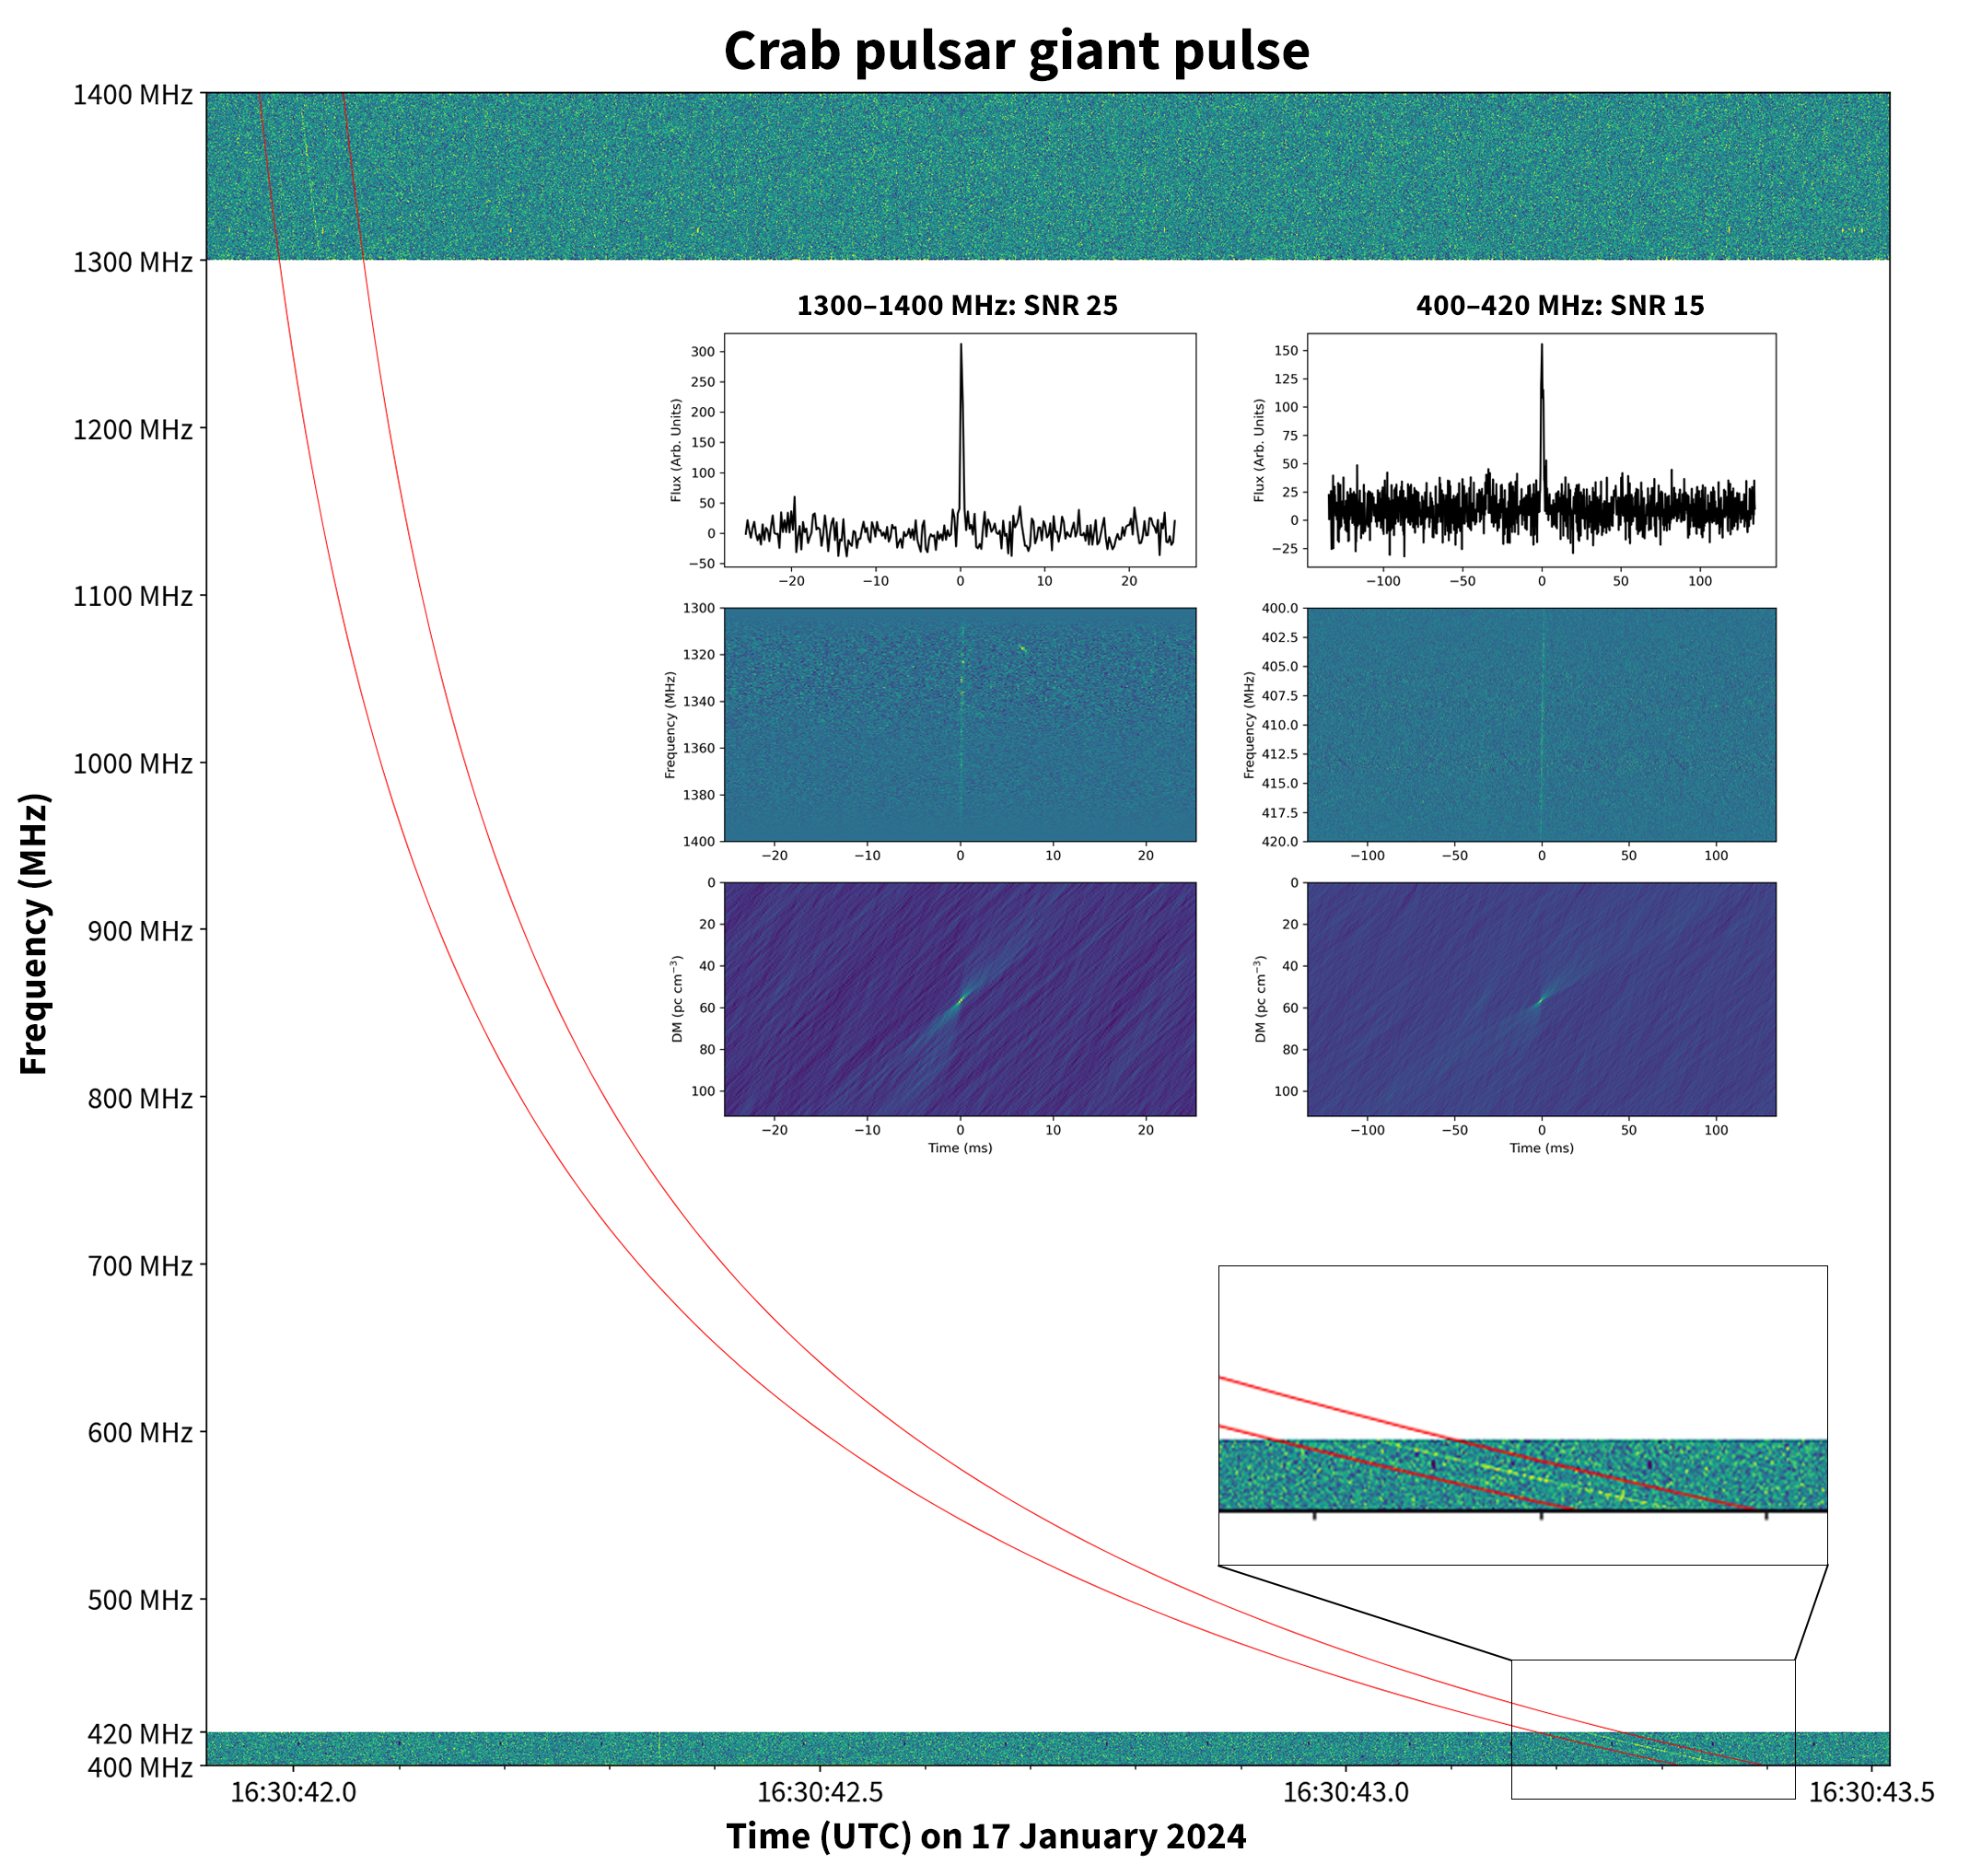 © CC-BY 4.0 Tammo Jan Dijkema
The picture shows the effect of dispersion: at the high frequencies, the radio emission arrives a good second earlier than at the low frequencies. The red lines show the theoretical dispersion.
The two top inset plots show the folded data after correcting for dedispersion (top), the dedispersed spectrum around the pulse (middle) and a DM-time diagram.
We are planning to use this set-up to detect other kinds of giant pulses as well.
