 © J.B.R. Oonk
The observed Carbon absorption feature at 45 MHz towards Cygnus A is associated with foreground gas in our own Galaxy. Its velocity is consistent with the cold neutral medium in the Orion spiral arm. From the observed line width and optical depth we determine that the gas has an electron temperature of about 110 K and an electron density of about 0.06 cm-3, albeit with large uncertainties. Observations at higher frequencies will help us to further constrain the properties of this gas.
Radio recombination lines associated with the extragalactic source Cygnus A itself were also searched for, but not detected. To the best of our knowledge this is the first time that foreground Milky Way radio recombination line absorption has been observed against a bright extragalactic source. This study paves the way for future detailed pinhole studies of the interstellar matter in our Galaxy.
The results are published in J.B.R. Oonk, R.J. van Weeren, F. Salgado, L.K. Morabito, A.G.G.M. Tielens, H.J.A. Rottgering, A. Asgekar, G.J. White, et al. ( 2014 MNRAS 437 3506, http://arxiv.org/abs/1401.2876 ). The above figure shows the foreground Carbon absorption detected along the line of sight to Cygnus A as observed with LOFAR LBA around 45 MHz.
 © A. Needham
 © Madroon Community Consultants (MCC)
 © W. Frieswijk
 © Kristina Nyland, ApJ
 © JWTH/ASTRON
 © Andre van Es
 © ASTRON
 © Madroon Community Consultants (MCC)
 © Albert van Duin
 © ASTRON
 © n.v.t.
 © ASTRON
 © Emma Rigby
 © copyright ASTRON
 © ASTRON
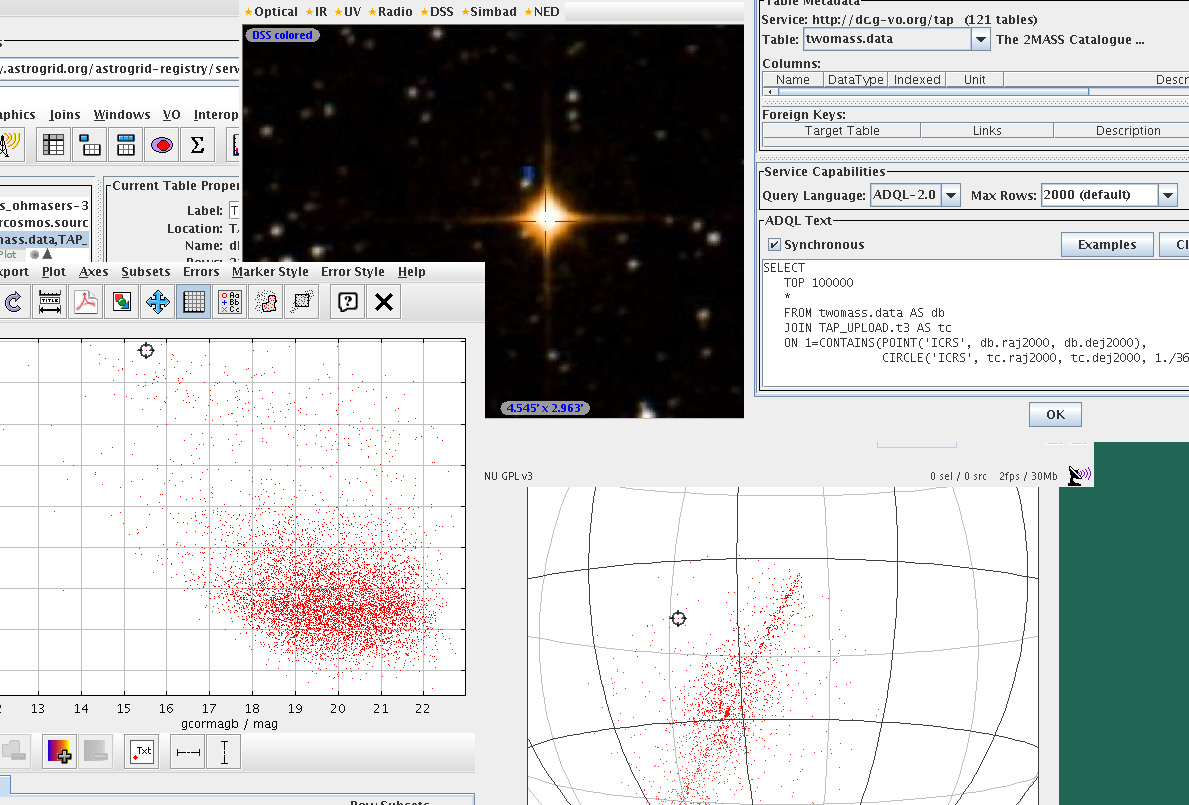 © Markus Demleitner
 © Justin Bray
 © (c) Astron 2014


