 © Brands, Oostrum, Wise
Many thanks go to Paul Boven, Zsolt Paragi, Luciano Cerrigone, and Roy Smits for their very valuable contributions in making demonstrations and presentations to the students.
© Brands, Oostrum, Wise
Many thanks go to Paul Boven, Zsolt Paragi, Luciano Cerrigone, and Roy Smits for their very valuable contributions in making demonstrations and presentations to the students.
 © DESP
To verify the correlator firmware module in simulation, we generated (12 telescopes * 2 polarizations) 24 input signals. For input 0, we generated a simple sine wave. For input 1, we used the same sine wave but phase-shifted it one degree with respect to input 0. For input 2, we used a 2 degree phase shift, and so on, up to input 23 which is phase-shifted 23 degrees relative to input 0. We then let the correlator firmware correlate these 24 signals, and plotted the resulting phase differences. The first (single channel) plot shows 0 degrees of phase shift between input 0 and input 0 (red color), up to 23 degrees of phase shift between input 0 and input 23 (blue color). This shows the correlator correctly processes a single channel.
As the correlator processes 64 channels, we included the channel filterbank firmware which produces 64 channels for each input. Instead of a single sine wave per input like we did the first time, we fed the sum of 13 sine waves (and we again phase shifted these sine waves) to each of the 24 inputs of the channel filterbank. The second graph shows plots of all 64 output channels of the correlator: 41 channels that do not carry a proper signal, and 13 channels that do.
The final graph highlights the 13 channels that should carry a signal, and we see the correct phase differences like in the first graph - the channel filterbank-correlator subsystem is working as expected.
Overall great progress has been made and a lot of uncertainties have been taken away. There is still work to do, but we have confidence that we can provide a correlator that can generate the first Apertif fringes in August 2015.
Daniel van der Schuur
Hajee Pepping
 © DESP
To verify the correlator firmware module, we generated (12 telescopes * 2 polarizations) 24 input signals. Each input was the same simple sine wave, but shifted by one degree in phase w.r.t. its neighbour. We then let the correlator firmware cross-correlate these 24 signals, and plotted the resulting phase differences. The first (single channel) plot shows 0 degrees of phase shift between input 0 and itself (red), up to 23 degrees of phase shift between input 0 and input 23 (blue). This shows that the correlator correctly processes a single channel.
As the correlator processed 64 channels, we included the channel filterbank firmware, which produces 64 channels for each input. Instead of a single sine wave per input, we now fed the sum of 13 sine waves (again shifted in phase w.r.t. each other) to each of the 24 inputs of the channel filterbank. The second graph shows plots of all 64 output channels of the correlator: 41 channels that do not carry a proper signal, and 13 channels that do.
The final graph highlights (color) the 13 channels that should carry a signal, and again we see the correct phase differences - the channel-filterbank-correlator subsystem is working as expected.
Overall, great progress has been made and a lot of uncertainties have been taken away. There is still work to do, but we are still on track of having a correlator system that can generate the first Apertif fringes in August 2015.
 © Madroon Community Consultants (MCC)
The picture shows Tim Cornwell and Mark Waterson of the SKA Office, being made welcome once again in Dwingeloo. They are engaged in a frank exchange of views with Ger de Bruyn (leader of the LOFAR EoR program), Michiel Brentjens (the man who understands LOFAR most intimately) and Jan Geralt bij de Vaate (head of the SKA Low Frequency Aperture Array consortium).
(*) Sometimes called LOFAR++. It is expected that, despite its smaller number of antennas, LOFAR will be the more mature instrument for some years, and thus continue to be a trail-blazer (and Northern Hemisphere complement) for SKA_low.
 © kapteyn/astron
Verheijen receives the Vici grant of 1.5 million Euros for the scientific exploitation of the innovative APERTIF radio camera, built by ASTRON for the Westerbork telescope. Taking advantage of phased-array technology, APERTIF will operate in the 21-cm band and enhance the survey speed of the Westerbork telescope more than tenfold. Verheijen and his team will survey large areas of the nearby Universe and map in great detail the distribution and motions of atomic hydrogen gas in and around tens of thousand of galaxies.
These observations will map the distribution of mass in galaxies, measure the dynamical state of gas disks, identify the smallest gas-rich galaxies and reveal physical processes such as (weak) tidal interactions, gas accretion and ram-pressure stripping in various cosmic environments. This provides unique information for a better understanding of how galaxies evolve in the local Universe and how they have changed their gas content over the past 3 billion years of cosmic time.
As co-PI of the APERTIF project, Verheijen will carry out his research at the nearby Kapteyn Institute in close collaboration with researchers at ASTRON.
 © (c) Astron 2015
The images shown here were observed in the high band from 115 to 170 MHz, while low band observations were happening using the very same stations. Every frame consists of 5.5 seconds of data, recorded at a cadence of once per 5 minutes.
Soon after the first images appeared on twitter, an ad-hoc team of colleagues showed up in the control room to volunteer their services. In the end we had Roy van der Werp (media contacts and Astron overview page about the solar eclipse), Jan David Mol and Wouter Klijn (social media and notification of various web sites), Tammo Jan Dijkema (creating and updating movies of the eclipse up to the latest image, see movie), Ronald Halfwerk (Astron branding, and creating of eclipse movies combined with introductions to LOFAR and Astron), and Michiel Brentjens (observations and imaging).
RTV Drenthe recorded a : nice item about the only place in the Netherlands from which the eclipse could be followed from start to end.
Today, these images will be presented at the Dutch Astronomer's Conference (#NAC2015).
 © Madroon Community Consultants (MCC)
(*) One of the rare exceptions is galactic polarization, of course.
(**) Marcel Minnaert "De natuurkunde van 't vrije veld" (1937-1942)
 © Albert van Duin
This compact group consists of three galaxies: NGC 5981, NGC 5982 and NGC 5985 (right to left in the image), all roughly at the same distance (100 lightyears)from us.
The group is photogenic because it consists of an edge-on, an elliptical and a face-on galaxy. NGC 5985 is classified as a Seyfert galaxy, so it's an active galaxy, and NGC 5982 (the middle one) shows faint outer shells, proof that galactic mergers may have happened in the past.
The total integration time is 13 hours, on April 17, 19 & 20, 2015 with a 40cm telescope in Beilen. More images can be found at: http://www.astrobin.com/users/Albert_van_Duin/
 © Please refer to Neal Jackson, for the LOBOS collaboration.
As well as evaluating the suitability of the pointed source, we can use fringe rates and delays, on baselines between the superterp and international stations, to produce a map of the field. The picture shows one such field, where the greyscale shows our map and the crosses show bright WENSS sources. We detect a number of these sources, apart from small offsets in delay.
In this map, each baseline's fringe rate-delay plot produces its own parallelogram on the sky, which are overlaid to produce the final image.
 © Jeff Hodgson (MPIfR)
We find that at mm-wavelengths, blazars tend to exhibit two or more quasi-stationary features with either exhibiting "core-like" features, suggesting that they both could be similar or related phenomena. The emission we observe at radio frequencies is thought to be produced by synchrotron emission due to relativistic electrons gyrating around magnetic field lines. At longer wavelngths, this emission is self-absorbed and opaque, but at mm-wavelengths, it becomes transparent. We find that super-luminally travelling components often correlate with both Gamma-ray emission and optically thin emission when they pass these stationary features. Hence, we suggest that these stationary features are consistent with being either recollimation or oblique shocks caused by the overpressure of the jet relative to the external medium and that Gamma-ray emission is sometimes due to travelling disturbances within the jets passing these shocks.
Using multi-frequency VLBI, we can also derive estimates of the magnetic field strength and spatially resolve these strengths as a function of separation from the ``core''. This allows us to not only measure how the magnetic field strength drops further from the central SMBH, but also how far the ``core'' is from the SMBH and hence estimate the strength of the magnetic field at the base of the jet (presumed to be at or near the SMBH). Based on the analysis of 6 sources and one in-depth analysis of the source OJ 287 including full kinematics and the inclusion of lower frequency VLBI data, we find that the ``core'' is approximately 1-3 parsecs downstream of the jet base. The extrapolated magnetic field strength at the jet base is ~5-20 kG - which is consistent with magnetically launched jets, at or near their theoretical maximums. If this is the case, this could offer a "standard quantity" that could potentially be measured independent of redshift.
 © Photos by Leon Oostrum
As you can see in the pictures, the conference was built up around a series of talks and posters. During coffee, over lunch/dinner, and at night, there was ample time to discuss and network. Thanks to one afternoon with three parallel sessions there was enough limelight to go around. A special session on Supercomputing in Astronomy featured a series of modeling and instrument talks, including one on SKA by Paul Alexander. The evening session on the first night, themed "Gender Diversity in Astronomy", was opened by a speech by minister Bussemaker. Two great talks by Brage and Rudolf next set the scene for a lively discussion by a panel and the audience, structured around 5 provocative propositions. The results go back to the minister.
 © DESP
To reach this milestone, we had to choose an architecture, draw a schematic and layout, check and re-check, revise and review...
At the beginning of May all 5600 components had arrived at Neways Leeuwarden, ready to be soldered on to the board. On the 13th of May UniBoard2 arrived at the lab and it was time for the nerve-wracking first power-up. After some small modifications (only a couple of the 20000 connections had to be changed), we had a successful power-up of all parts on UniBoard2. With a boundary scan test all input and output connections to the FPGAs were checked for correct soldering. Now the board was ready to be programmed with firmware to blink the LEDs. This is illustrated in the image.
The next step is to test the remaining FPGA interfaces, including DDR4 memory and some 384 ten gigabit transceivers. Reaching this point was a collaborative effort of the RadioNet3 UniBoard2 Joint Research Activity (JRA) partners, and with companies like Neways and QPI.
 © Mpati Ramatsoku; Davide Punzo; Marc Verheijen
The mosaic is built from 35 individual WSRT pointings in a hexagonal grid, directed towards a region in the sky where a filament of the Perseus-Pisces Supercluster (PPScl) crosses the plane of the Milky Way. The data cube covers a sky area of 2.4 x 2.4 degrees centered at alpha = 72 degree and delta = 45 degree. The redshift range is cz = 2000 - 17000 km/s. The resulting data cube has dimension 2300 x 2300 pixels for the spatial coordinates and 1717 pixels in the velocity dimension. This is around 10 times smaller in the velocity (frequency) dimension than a single APERTIF pointing, but the spatial resolution, velocity resolution and sensitivity are comparable.
The number of objects is also comparable as Perseus-Pisces is an over-dense region. The ~ 200 sources comprise
Full video of the mosaic can be found here:
https://www.youtube.com/watch?v=sS_5LrOS5bo
zomming on one source(WEIN069):
https://www.youtube.com/watch?v=yLjW9nbdO8g
 © Leandro Fiorin
In this year's edition, held in the island of Ischia, Italy, yet anotherteam of DOME researchers received the Best Paper Award for their paper titled "An energy-efficient custom architecture for the SKA1-Low central signal processor". The paper, written by Leandro Fiorin, Erik Vermij, Jan Van Lunteren, Rik Jongerius, and Christoph Hagleitner, explores the design of a custom architecture for supporting the execution of the algorithms of the central signal processor of the SKA1-Low. By taking advantage of emerging 3D-stacked-memory devices and by exploring the design space for a 14-nm implementation, the work estimates a power consumption of 14.4 W for processing all channels of a sub-band and an energy efficiency at application level of up to 208 GFLOPS/W for the proposed architecture.
Two other DOME papers were also presented at the conference: "An Instrumentation Approach for Hardware-Agnostic Software Characterization" by Andreea Anghel, Laura Mihaela Vasilescu, Rik Jongerius, Gero Dittmann and Giovanni Mariani, and "Scaling Application Properties to Exascale" by Giovanni Mariani, Andreea Anghel, Rik Jongerius, and Gero Dittmann.
The three works presented at the conference raised amongst the Computing Frontiers research community a significant interest towards the SKA and the DOME projects and the challenges waiting ahead in the path to the construction of the radio-telescope.
On the picture, a few highlights of the conference (left to right, top to bottom): networking before the social event, seafood starter, the welcome reception buffet, enjoying the social event dinner. On the background image, Ischia's Aragonese Castle.
 © photo by Harm-Jan Stiepel
About 40 project partner representatives, Work Package and Task leaders came to ASTRON to officially kick-start the project, and have the first face to face meetings to start the four year endeavour. Some key decisions were made - Mike Garrett was appointed ASTERICS coordinator, with Fabio Pasian (INAF) and Denis Mourard (CNRS) serving as chair and vice-chair of the General Assembly (Board). The Executive board was appointed (Garrett - chair, and WP leaders Searjent, Lamanna, Genova and Szomoru). The Management Support Team (MST) was also appointed - Rob van der Meer as Project Manager (1/2 time), Emmy Boerma as Project Assistant/Financial administration (also 1/2 time). A project scientist is the only MST position that remains to be filled. In any case, everyone is up to speed to make the project a big success.
 ©
©
In a recent effort by people on 5 continents(*), a new version of Casa was released, which contains the improvements that have been made by both NRAO and Astron. This new version 2.0 will underly NRAO's Casa software (as of version 4.4), as well as Astron's LOFAR software (as of version 2.10).
The release of Casacore paves the way for the release of a new AWImager: LOFAR extensions to the Casa imaging software.
In this release, Casacore was moved from googlecode to github - part of the reason for this is that googlecode is closing down. The new Casacore can be obtained from https://github.com/casacore/casacore . As a part of the move, pyrap has moved to github as well: https://github.com/casacore/python-casacore .
The image shows an overview of the different modules of Casacore. The size of the boxes are an indication of the number of lines of code. The total number of lines of code is about half a million, excluding comments.
(*) Editor's note: The spirit of AIPS++ lives on, fortunately
 © ASTRON
On the first floor, above the main entrance to the building we now have the magnificent "reading room", intended to be a place to withdraw oneself from daily concerns, and study or read in a pleasant and undisturbed atmosphere. It houses the latest issues of magazines, a collection of PhD. theses, some reference works, and the latest additions to the library collection.
On the basement floor, our large collection of books can be found. Properly arranged again, and all put together on nice shelves. In the picture, this work is being carried out by some members of the Library Committee, who are busy with re-shelving and ordering the collection of books so these can be easily found again. This turns out to be quite a job, as can be seen in the picture.
Also in the basement, but not visible from the main floor, one can find the "Library Archive", where we keep old volumes of magazines that are not (yet) available online for us. Access to these volumes can be provided by asking the receptionist. And you better be friendly to her to make sure she lets you out again...
The Committee hopes that the library will be more useful now. Please visit the new reading room and the basement library, and have a look around. And if you have, or know of, books that will add value to our library, do not hesitate to contact us! We will be happy to order them and provide them with a special place among their kin.
 © CS & LOFAR PWG; pulsar illustration credit: ESA/ATG medialab; Effelsberg photo credit: Jürgen Wohlfahrt; Lovell photo credit: Ian Morison; WSRT photo credit: Raimond Spekking; LOFAR image credit: Aerophoto Eelde
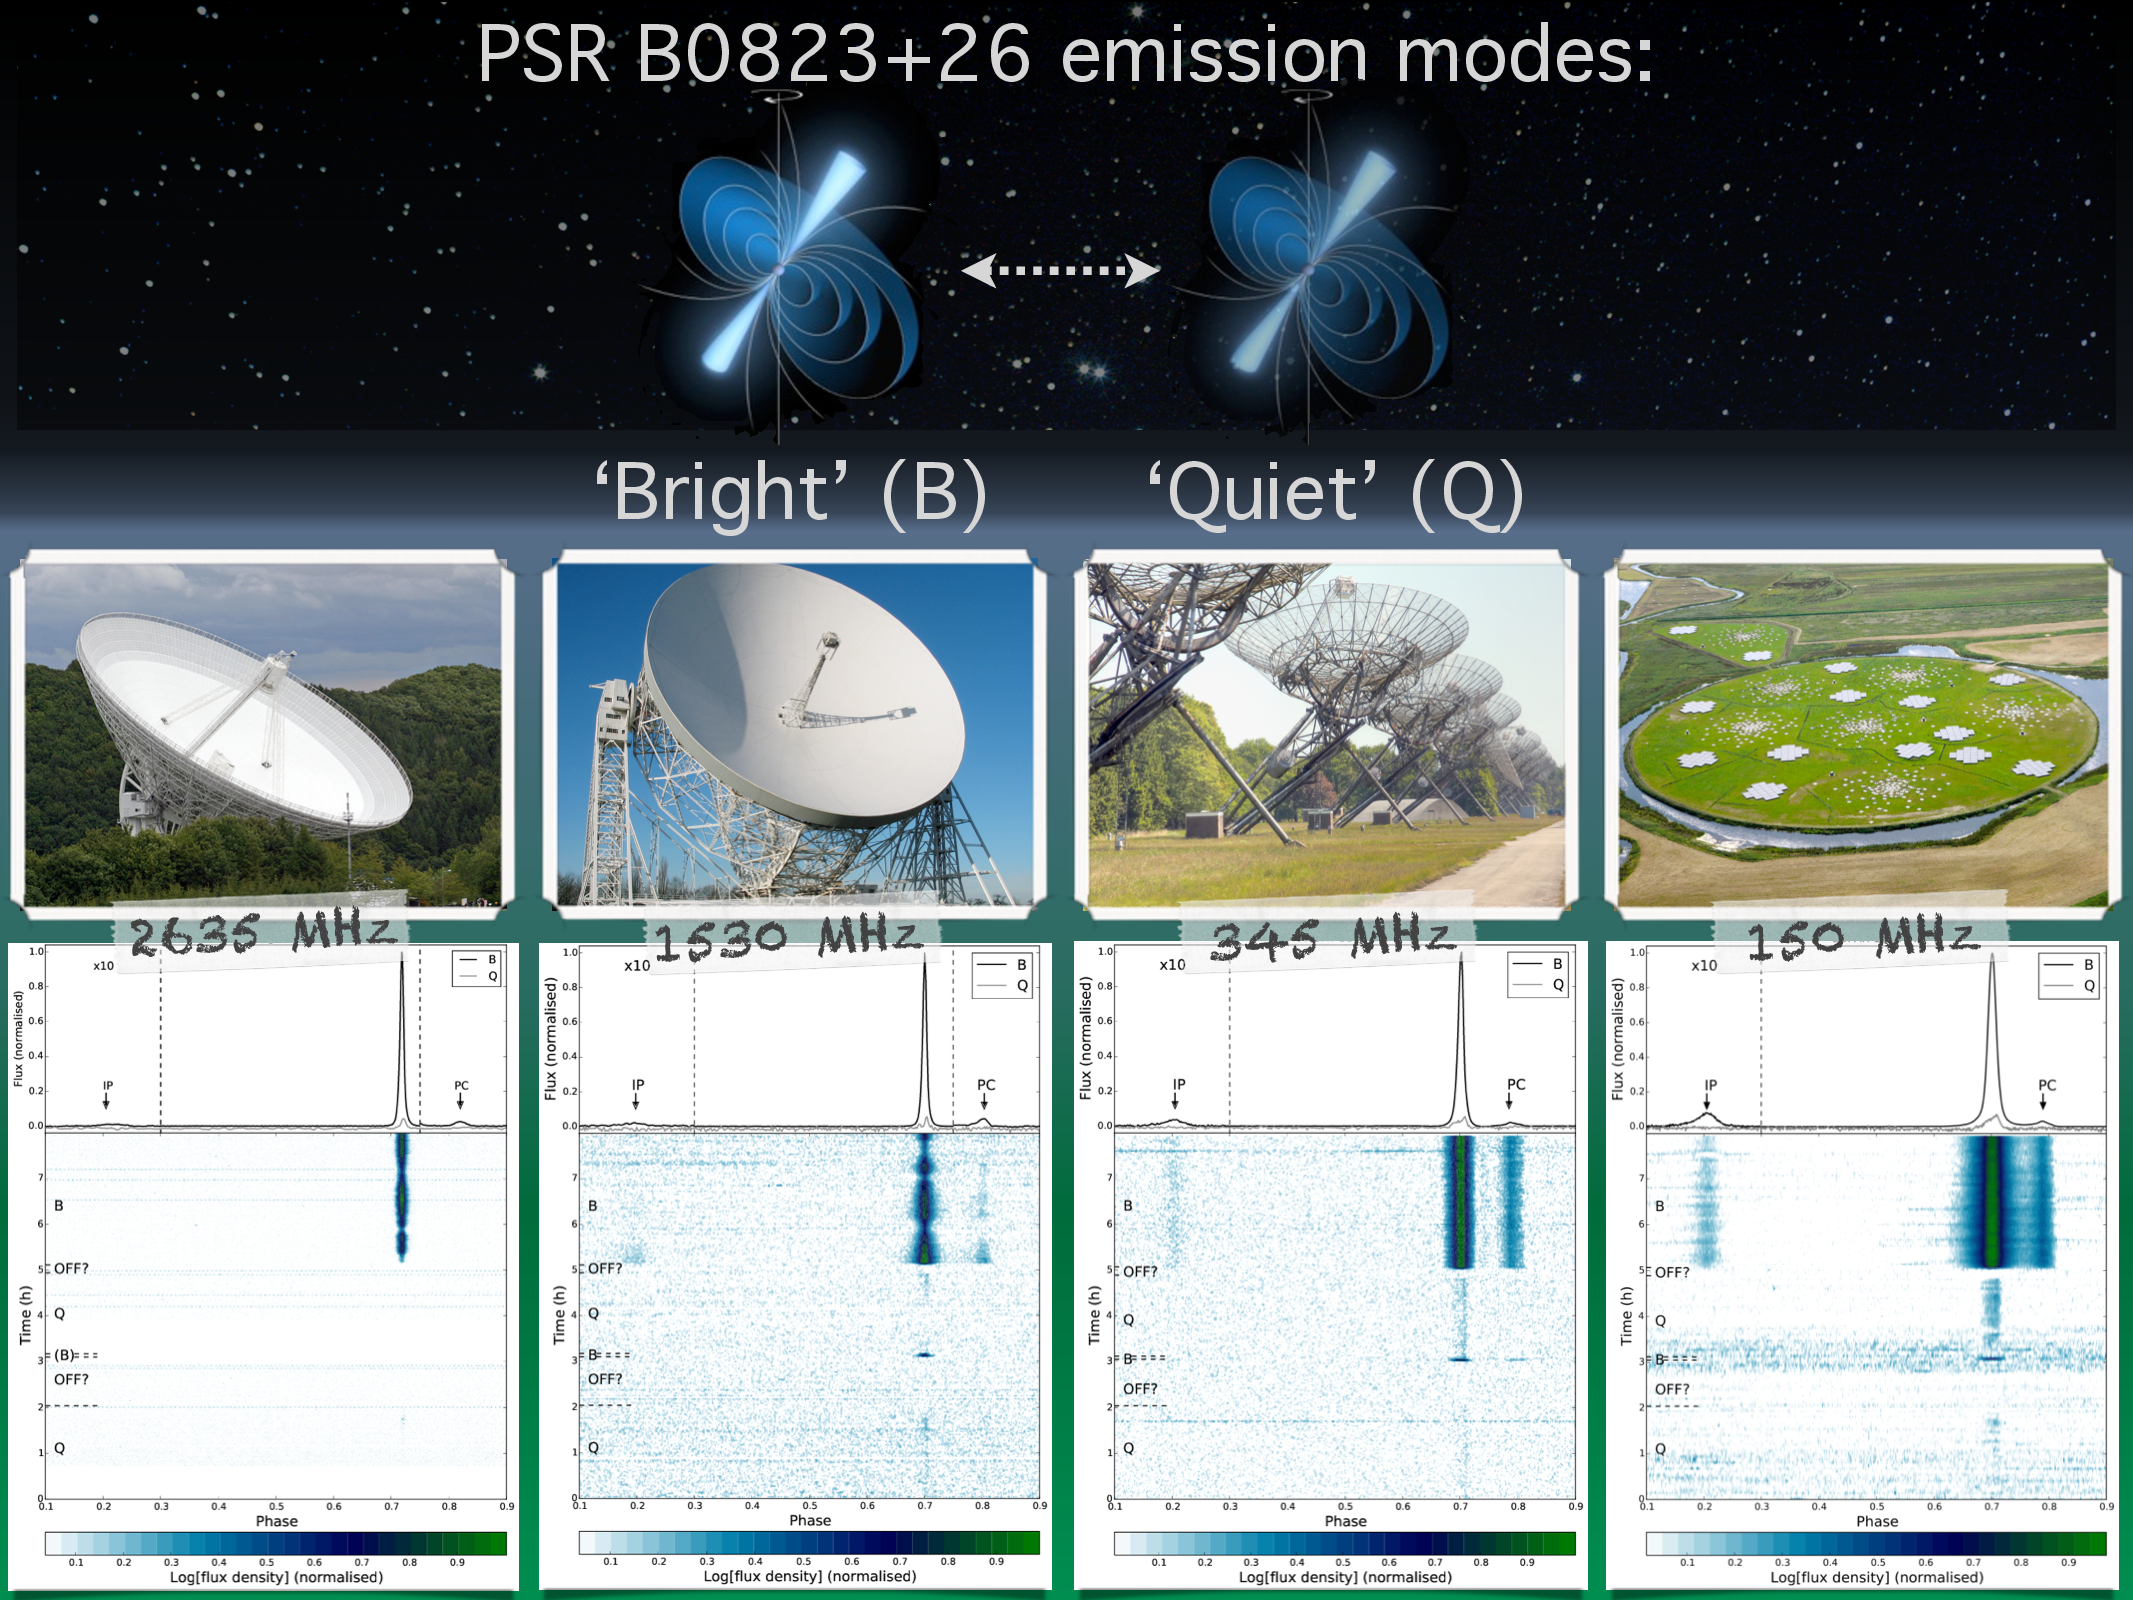
PSR B0823+26, a 0.53-s radio pulsar, displays a host of emission phenomena, including: subpulse drifting, nulling, and mode-changing (an abrupt switch in the pulsed emission between two or more well-defined pulse profile morphologies).
Studying pulsars that display many of these emission characteristics, such as PSR B0823+26 (and PSR B0943+10, another interesting mode changing pulsar, see here for previous daily images), provides further insights into the behaviour of the radio emission from the pulsar magnetosphere and the relationship between the various emission phenomena.
In a paper recently accepted by MNRAS, Sobey et al. 2015, we report on the discovery that PSR B0823+26 has a weak and sporadically emitting 'quiet' (Q) emission mode (using observations from LOFAR), that is over 100 times weaker (on average) and has a nulling fraction forty-times greater than that of the more regularly-emitting 'bright' (B) mode.
Simultaneous eight-hour observations taken using the LOFAR, Westerbork, Lovell, and Effelsberg telescopes (pictured from right to left above) between 110 MHz and 2.7 GHz are shown here. The lower plots in the image above show the flux density of the pulsar against pulse phase and integration time. The modes of emission identified (Q-, B-, and, tentatively, `OFF?') are labelled, and are delimited by the dashed lines. Modulation of the B-mode brightness due to scintillation is visible in the higher frequency Lovell and Effelsberg data. The plots above these show the time- and frequency-averaged pulse profiles separated into Q-mode (grey lines; 10x magnified) and B-mode (black lines). The B-mode postcursor (PC) and interpulse (IP) pulse profile components are also indicated by the arrows. These observations show that the transition between the Q-mode and B-mode is concurrent across the range of frequencies observed.
 © ASTRON
The Users Meeting - held on Monday afternoon, June 1- was open to the whole LOFAR community and provided a forum for users to both learn about the status of the array as well as give feedback. Members of the Radio Observatory gave updates on the current operational status, ongoing developments, and plans for the coming year. Among the important enhancements introduced in the system, the addition of new international stations to the array, the introduction of new software pipelines into the operational system, and new techniques to improve the quality of LOFAR images were overviewed. Representative users from the community were also invited to share their personal experiences from using the system. The Radio Observatory answered questions and gathered a lot of good feedback that will be used to improve the user experience. The final session of the meeting was dedicated to discussing options for improvements / extensions / upgrades to LOFAR in the coming years.
The Users Meeting was followed on Tuesday by a two day LOFAR Community Science Workshop where members of the LOFAR collaboration presented their latest science results and shared ideas and experiences about doing science with LOFAR. The science workshop program covered the gamut of the LOFAR science case from cosmology and extragalactic research to Galactic and solar system topics. An amazing range of results were presented including new record-breaking sub-arc imaging with LOFARs international baselines, the low-band image of Virgo A, the most precise and probably most accurate Cosmic Rays composition measurements, and the large scale Galactic emission in both total intensity and polarisation.
All these achievements clearly show that LOFAR remains a growing and scientifically exciting instrument with an active scientific user community. The science workshop picture is shown here.
 © ESA and the Planck Collaboration
In my talk I will summarise these results and their implications on our cosmological paradigm (the so-called 'Lambda-CDM model'), including the solution to the recent, vigorous discussion on the detection or non-detection of primordial gravitational waves, which are generally considered the smoking gun evidence for inflation. Besides that, you will learn about the latest and so far most accurate determination of cosmological parameters and constraints on early universe physics, dark energy, effective number and total mass of active neutrinos, primordial nucleosynthesis, dark matter, and recombination.
I will compare the Planck 2014 results to those of other cosmology probes, including both early and late universe observations, briefly discuss potential problems and anomalies, and what we can expect from future experiments in cosmology. All this is preceded by a short introduction of the history of CMB research, facts and figures on the Planck satellite and mission, and an outline of the current cosmological paradigm.
The talk is directed to a general physics and astronomy audience and does not presuppose special knowledge in cosmology.


